
3-ESS2-1: Seasonal Weather Conditions
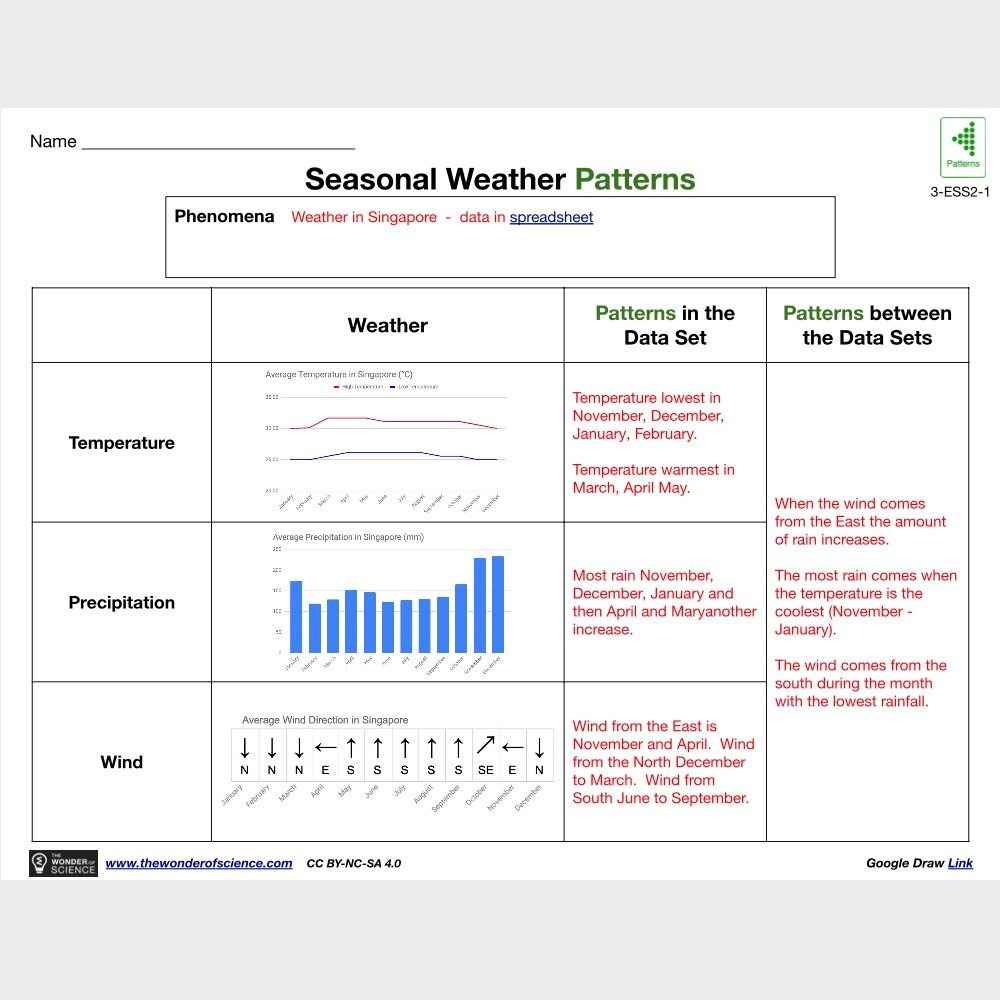
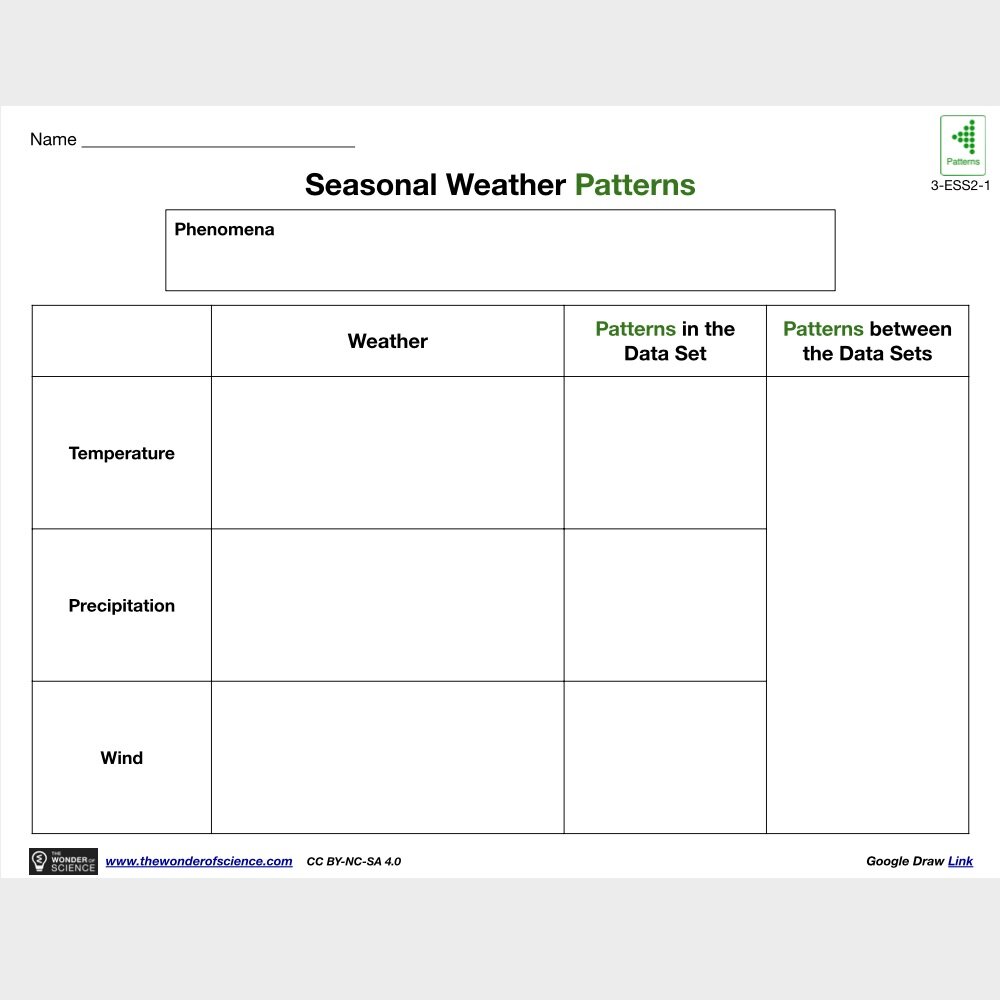
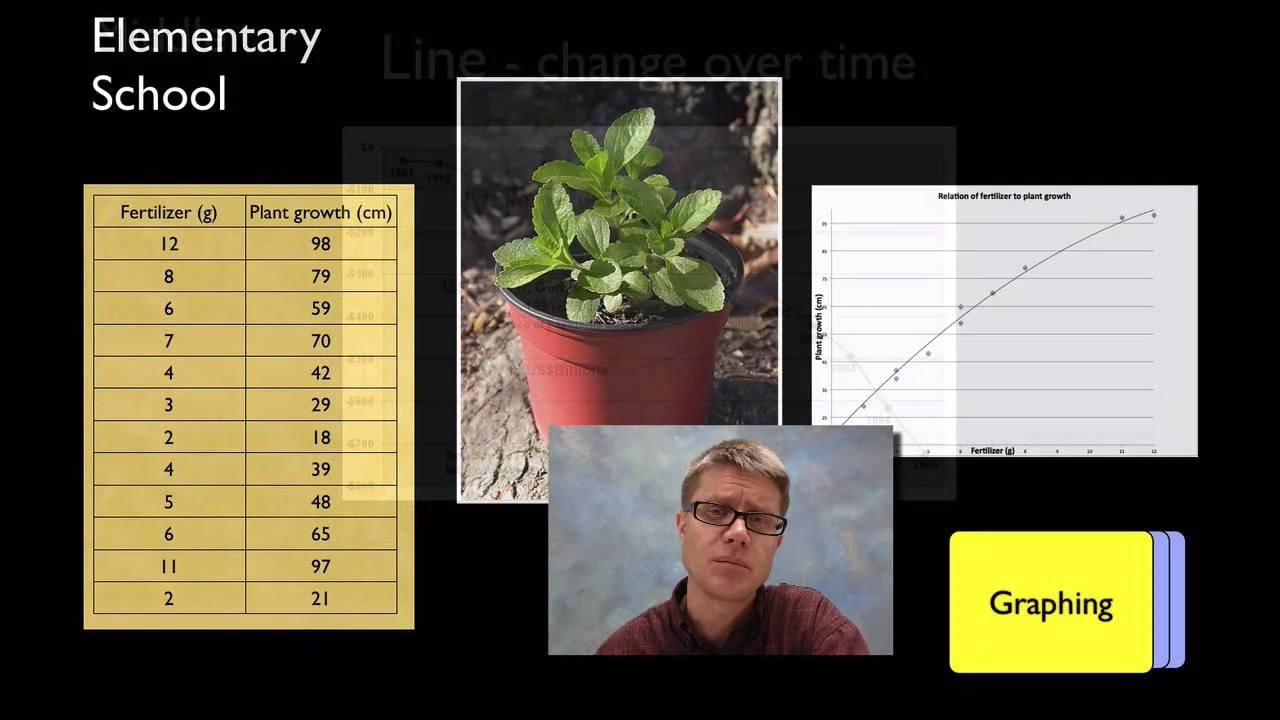
Represent data in tables and graphical displays to describe typical weather conditions expected during a particular season. (Patterns)
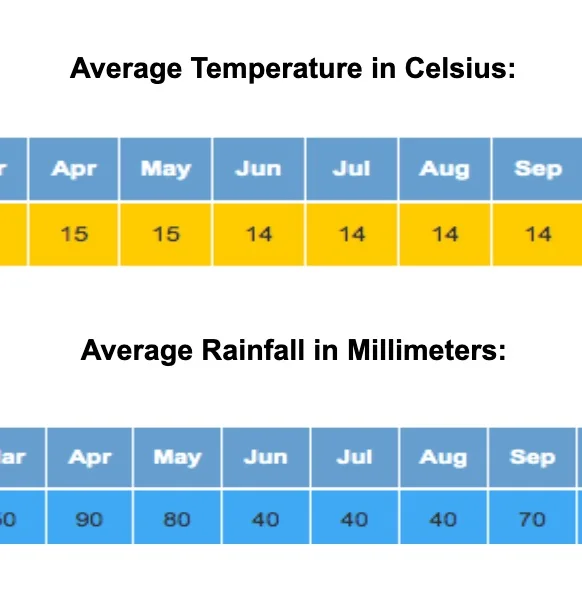
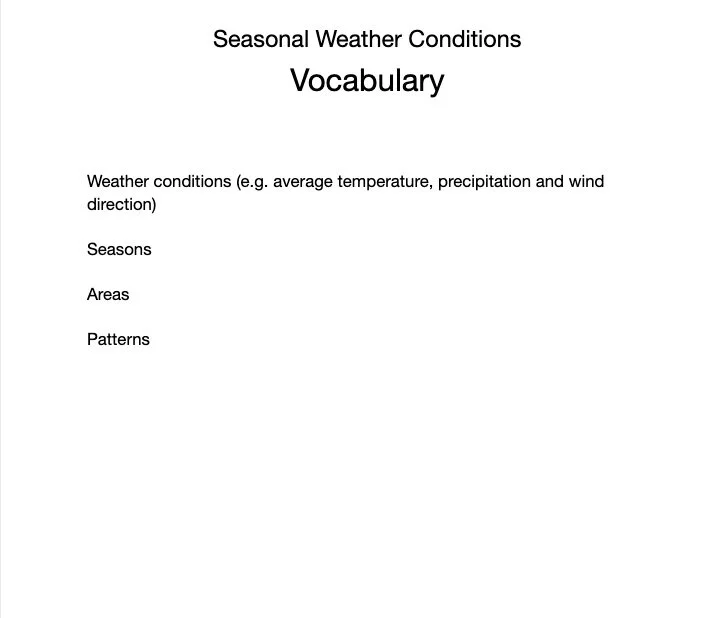
Clarification Statement: Examples of data could include average temperature, precipitation, and wind direction.
Assessment Boundary: Assessment of graphical displays is limited to pictographs and bar graphs. Assessment does not include climate change.
Science Practices
Analyzing and Interpreting Data
Disciplinary Core Ideas
ESS2.D: Weather and Climate
Crosscutting Concepts
Patterns
Assessments


The Wonder of Science Assessments

Shared Assessments
The following assessments were shared by teachers implementing the NGSS. Many of these are drafts and should be used accordingly. Feel free to improve these assessments or contribute your own. Learn more here.

Instructional Resources
Mini Lessons

The Wonder of Science Resources


Shared Resources

Anchor Charts


Phenomena


Videos

Learning Plans

Storylines


Common Core Connections
Mathematics
3.MD.A.2 - Measure and estimate liquid volumes and masses of objects using standard units of grams (g), kilograms (kg), and liters (l). Add, subtract, multiply, or divide to solve one-step word problems involving masses or volumes that are given in the same units, e.g., by using drawings (such as a beaker with a measurement scale) to represent the problem.
3.MD.B.3 - Draw a scaled picture graph and a scaled bar graph to represent a data set with several categories. Solve one- and two-step "how many more" and "how many less" problems using information presented in scaled bar graphs.
MP.2 - Reason abstractly and quantitatively.
MP.4 - Model with mathematics.
MP.5 - Use appropriate tools strategically.
*Next Generation Science Standards is a registered trademark of Achieve. Neither Achieve nor the lead states and partners that developed the Next Generation Science Standards were involved in the production of this product, and do not endorse it. Visit the official NGSS website.
