
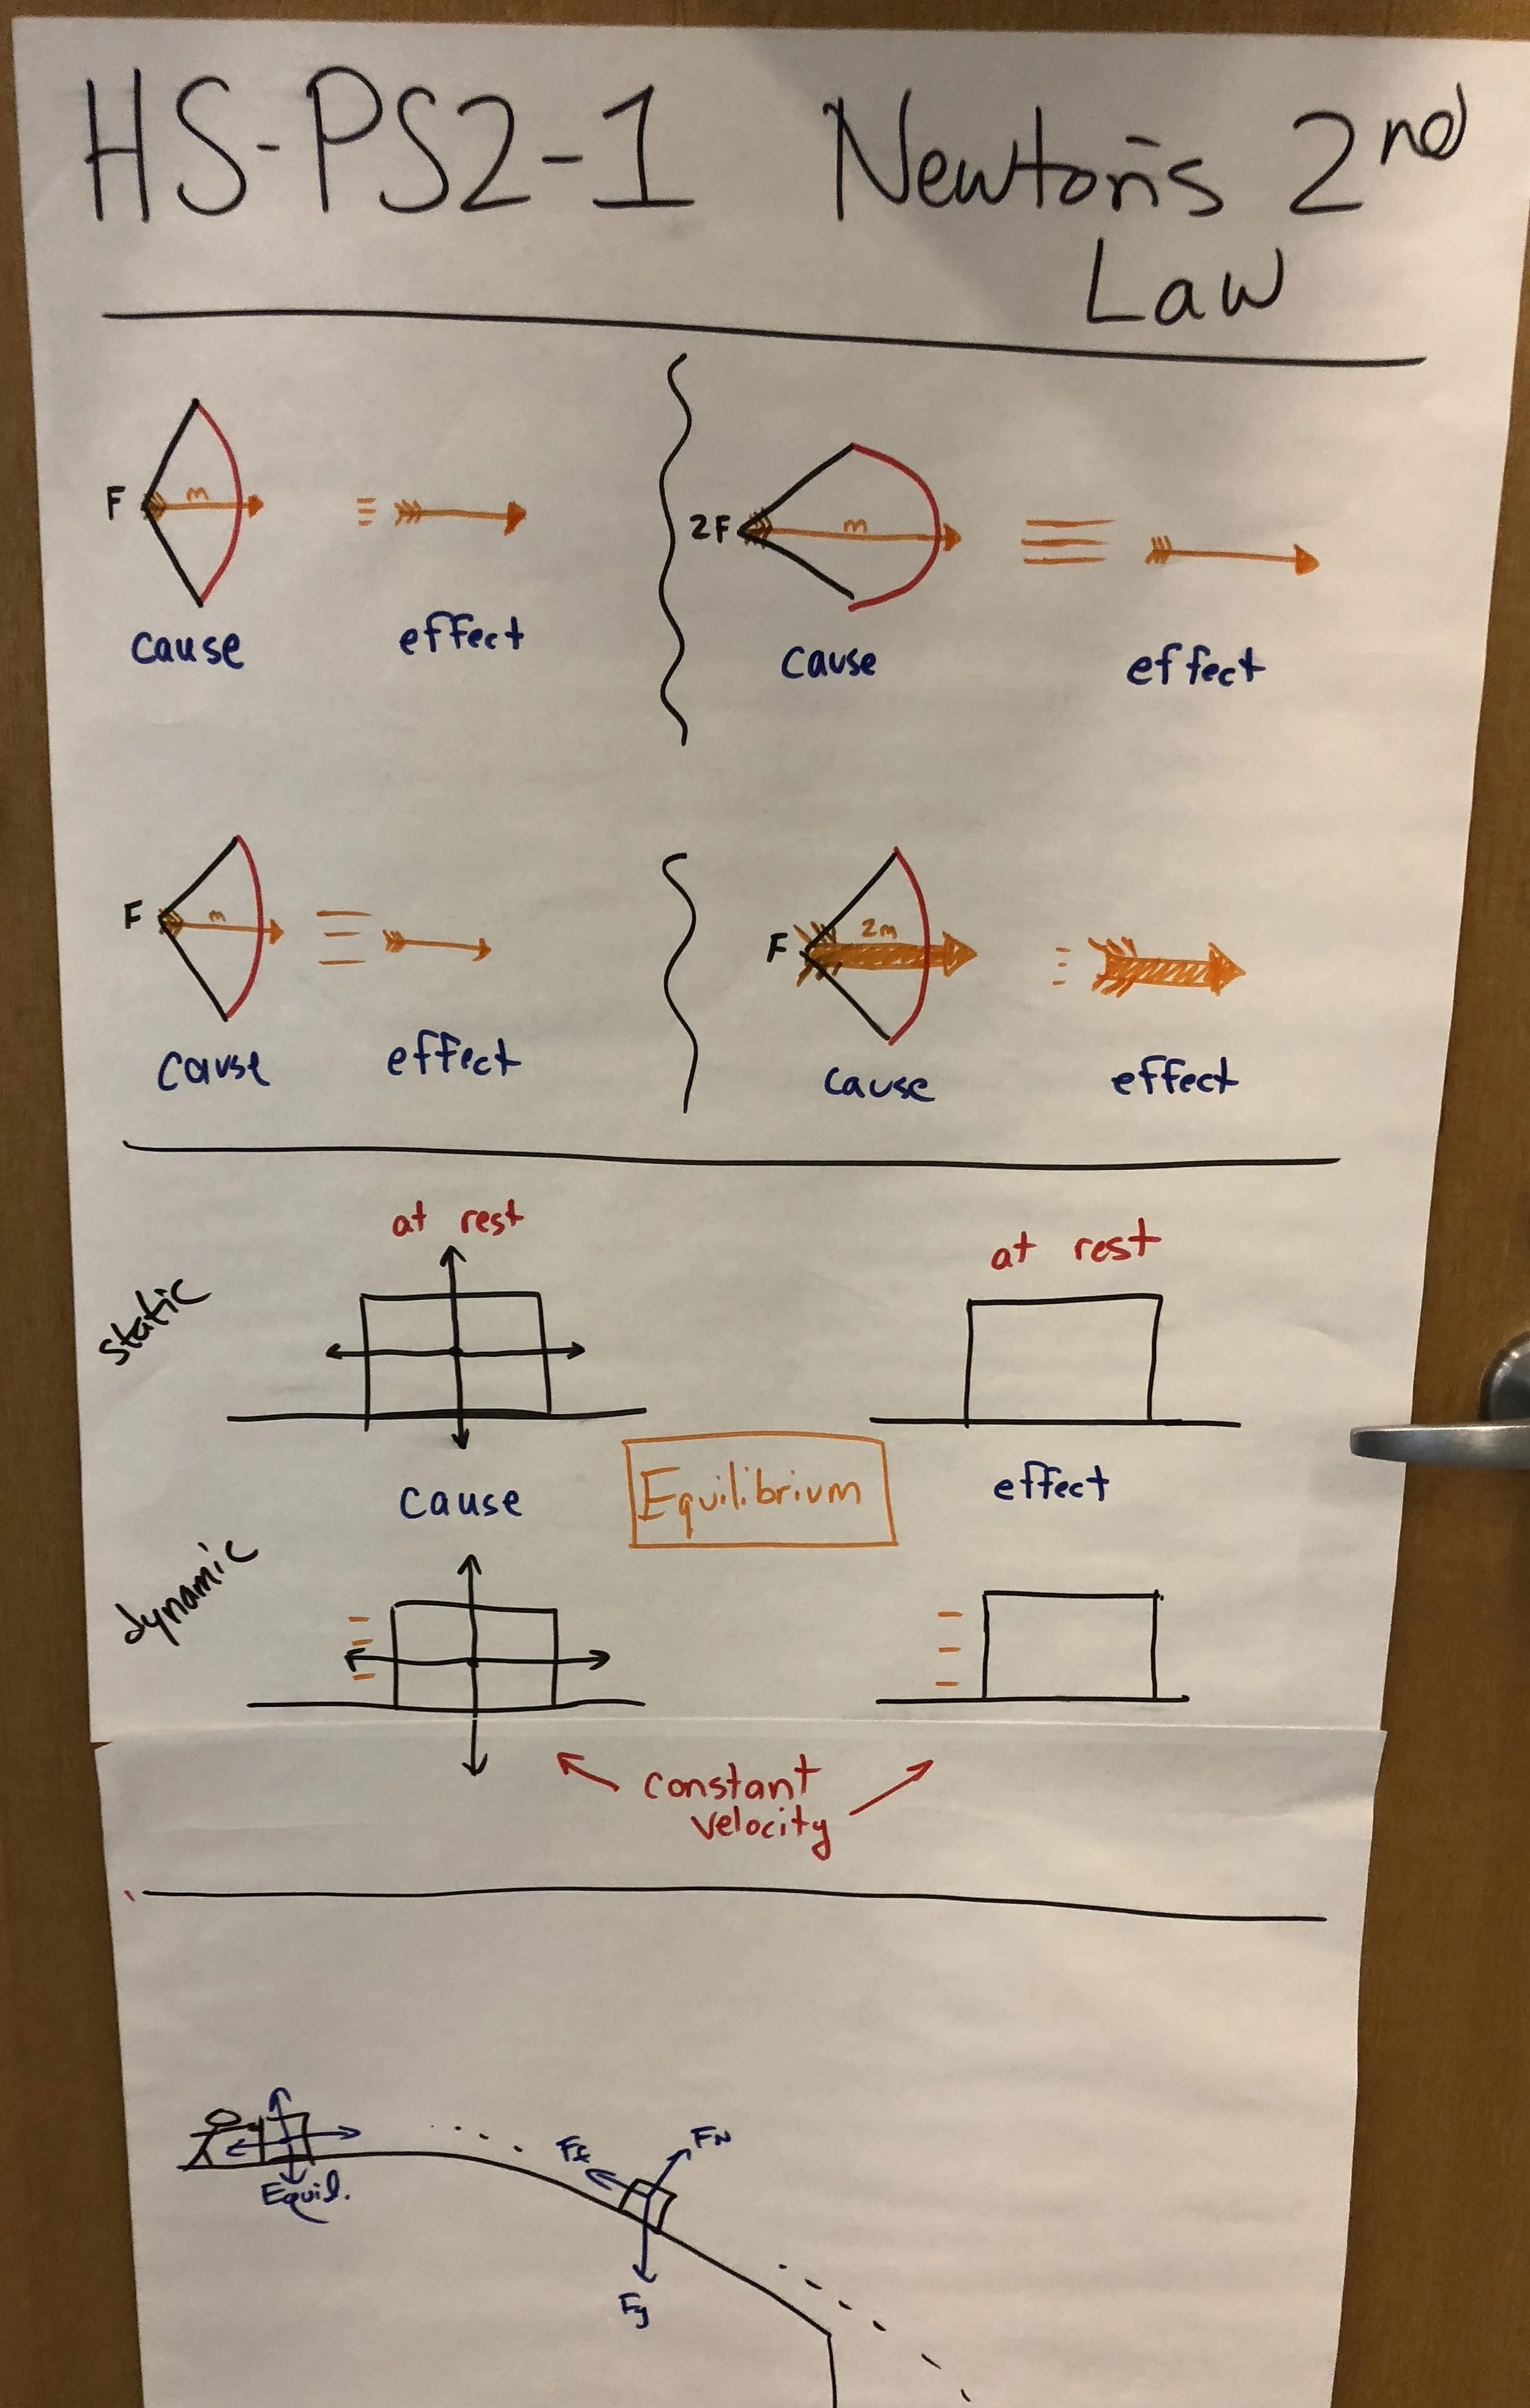
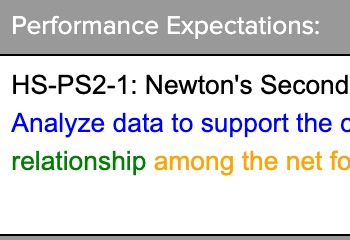
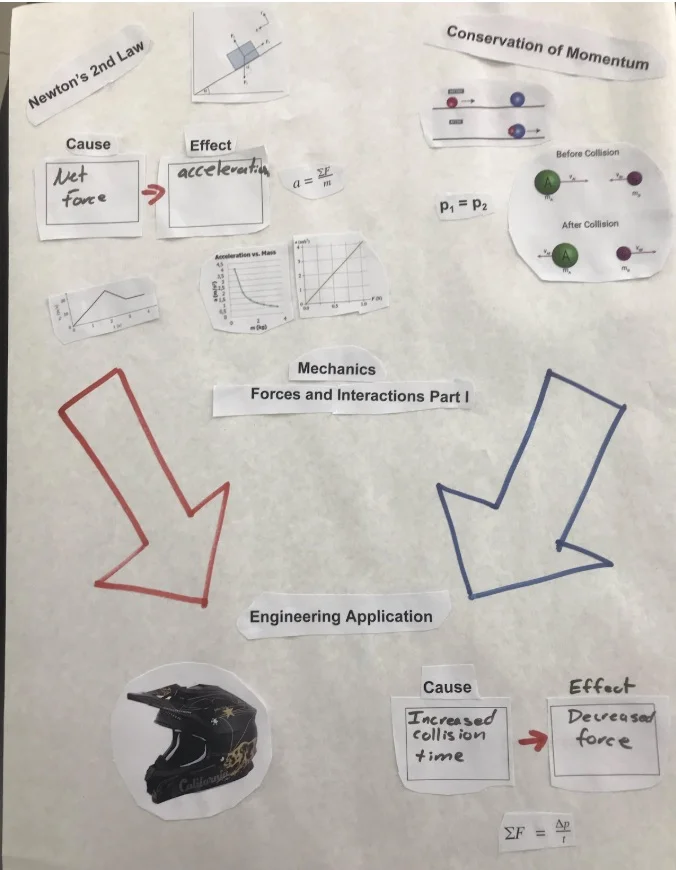
HS-PS2-1: Newton's Second Law of Motion
Analyze data to support the claim that Newton’s second law of motion describes the mathematical relationship among the net force on a macroscopic object, its mass, and its acceleration. (Cause and Effect)
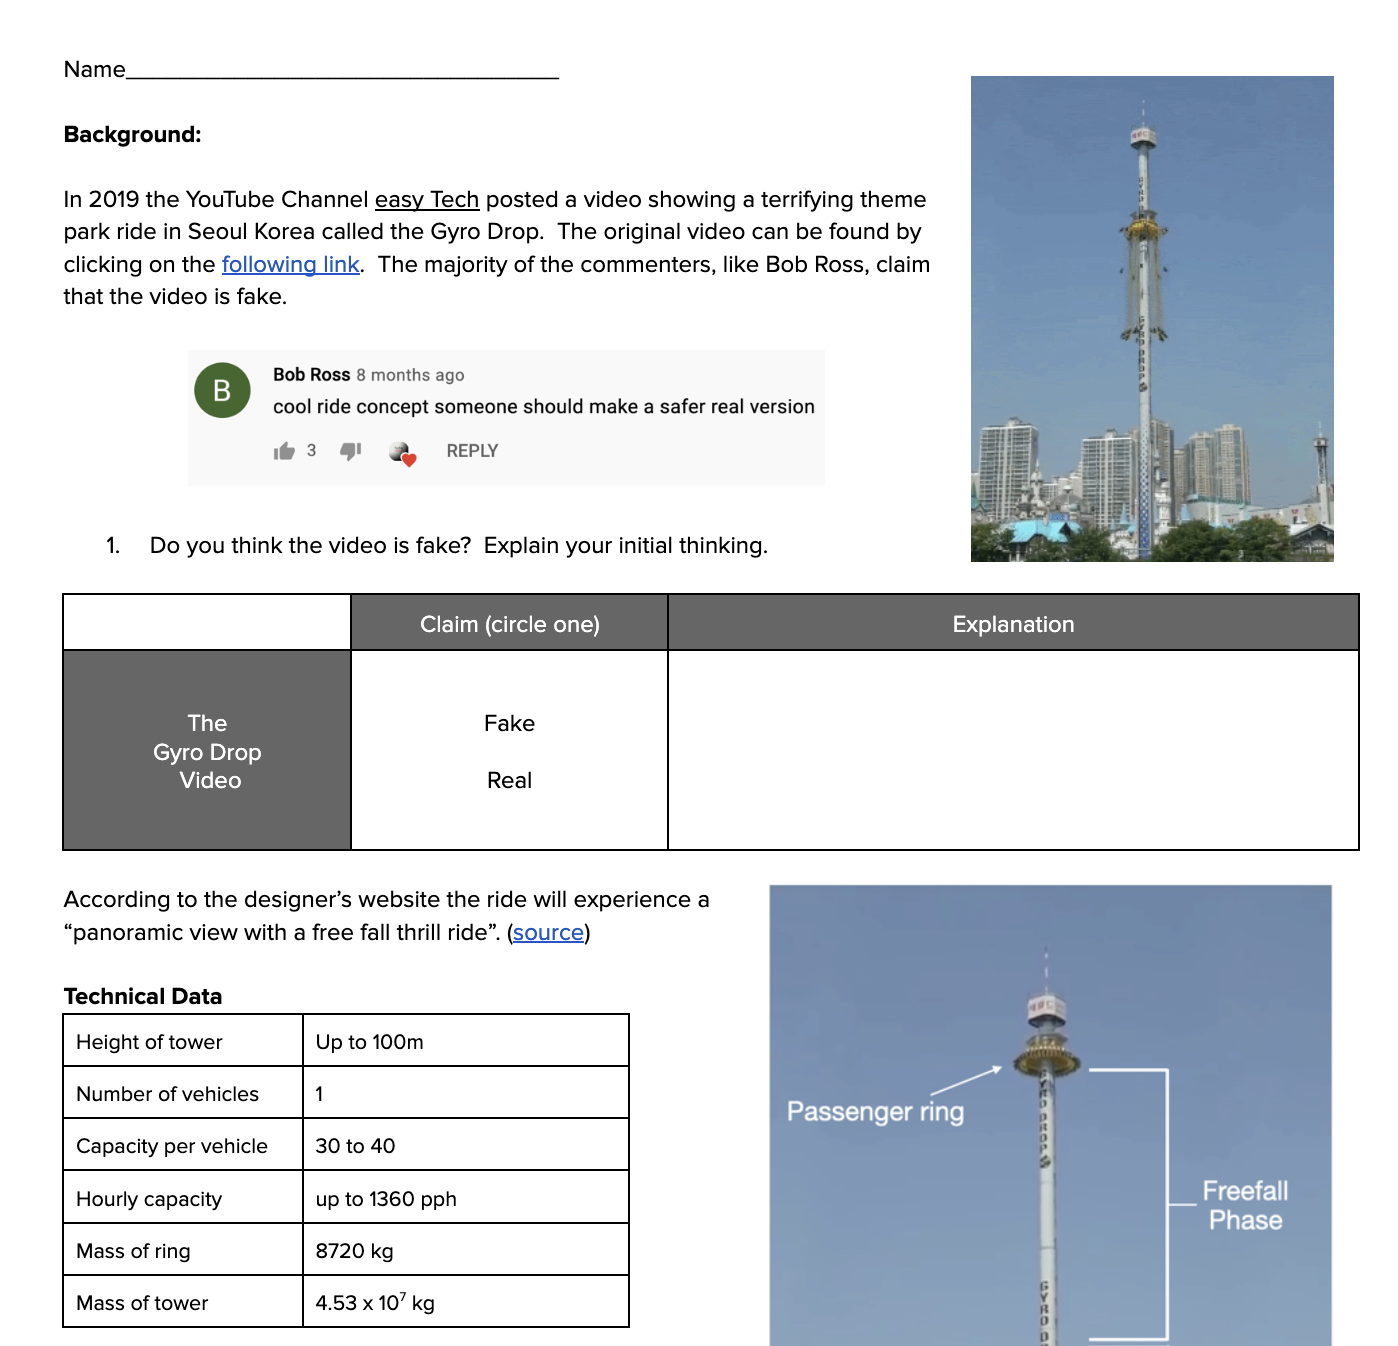
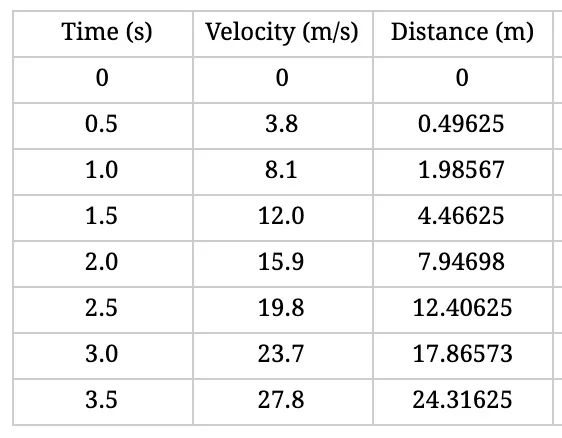
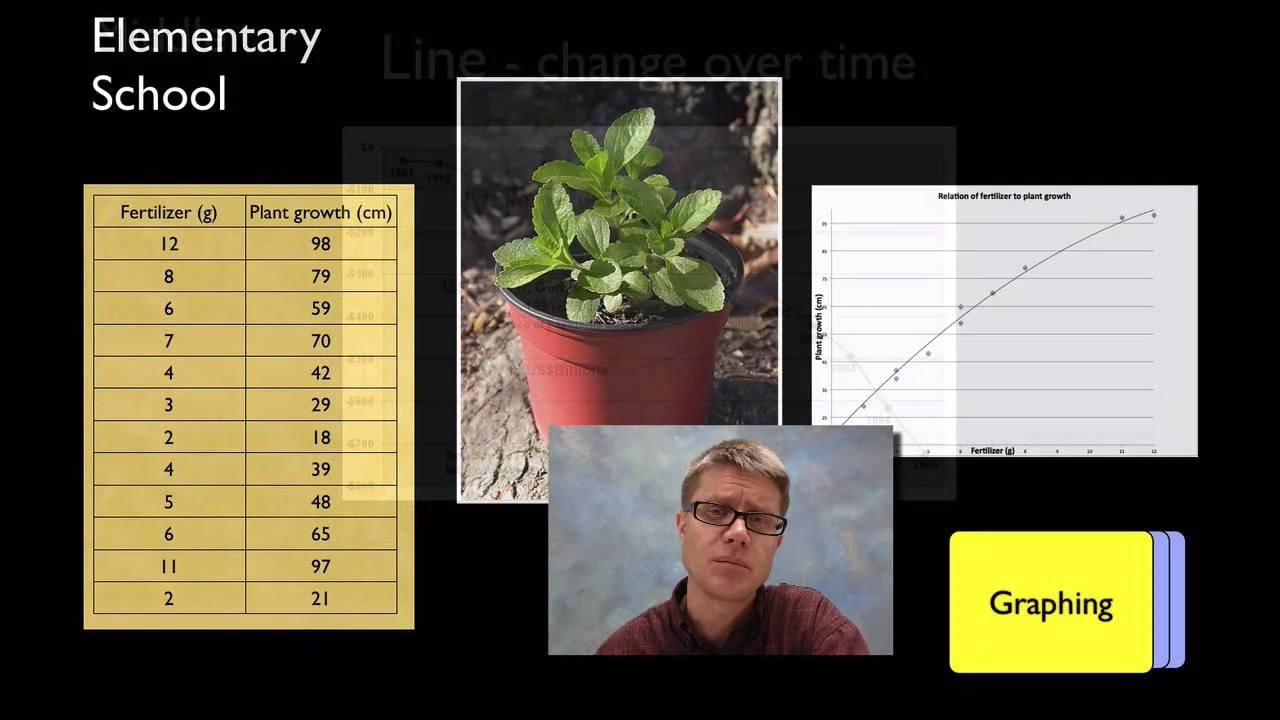
Clarification Statement: Examples of data could include tables or graphs of position or velocity as a function of time for objects subject to a net unbalanced force, such as a falling object, an object rolling down a ramp, or a moving object being pulled by a constant force.
Assessment Boundary: Assessment is limited to one-dimensional motion and to macroscopic objects moving at non-relativistic speeds.
Science Practices
Analyzing and Interpreting Data
Disciplinary Core Ideas
PS2.A: Forces and Motion
Crosscutting Concepts
Cause and Effect
Assessments


The Wonder of Science Assessments

Shared Assessments
The following assessments were shared by teachers implementing the NGSS. Many of these are drafts and should be used accordingly. Feel free to improve these assessments or contribute your own. Learn more here.


Instructional Resources
Mini Lessons

The Wonder of Science Resources


Anchor Charts
Phenomena


Videos


Learning Plans

Storylines


Common Core Connections
ELA/Literacy
RST.11-12.1 - Cite specific textual evidence to support analysis of science and technical texts, attending to important distinctions the author makes and to any gaps or inconsistencies in the account.
RST.11-12.7 - Integrate and evaluate multiple sources of information presented in diverse formats and media (e.g., quantitative data, video, multimedia) in order to address a question or solve a problem.
WHST.11-12.9 - Draw evidence from informational texts to support analysis, reflection, and research.
Mathematics
HSA-CED.A.1 - Create equations and inequalities in one variable and use them to solve problems. Include equations arising from linear and quadratic functions, and simple rational and exponential functions.
HSA-CED.A.2 - Create equations in two or more variables to represent relationships between quantities; graph equations on coordinate axes with labels and scales.
HSA-CED.A.4 - Rearrange formulas to highlight a quantity of interest, using the same reasoning as in solving equations.
HSA-SSE.A.1 - Interpret expressions that represent a quantity in terms of its context.
HSA-SSE.B.3 - Choose and produce an equivalent form of an expression to reveal and explain properties of the quantity represented by the expression.
HSF-IF.C.7 - Graph functions expressed symbolically and show key features of the graph, by hand in simple cases and using technology for more complicated cases.
HSN-Q.A.1 - Use units as a way to understand problems and to guide the solution of multi-step problems; choose and interpret units consistently in formulas; choose and interpret the scale and the origin in graphs and data displays.
HSN-Q.A.2 - Define appropriate quantities for the purpose of descriptive modeling.
HSN-Q.A.3 - Choose a level of accuracy appropriate to limitations on measurement when reporting quantities.
HSS-ID.A.1 - Represent data with plots on the real number line (dot plots, histograms, and box plots).
MP.2 - Reason abstractly and quantitatively.
MP.4 - Model with mathematics.
*Next Generation Science Standards is a registered trademark of Achieve. Neither Achieve nor the lead states and partners that developed the Next Generation Science Standards were involved in the production of this product, and do not endorse it. Visit the official NGSS website.
